Has Houthakker-Magee Gone Missing? Observations for China and the Global Economy
June 4, 2014
One of the most durable relationships in international macroeconomics and trade is “Houthakker-Magee” (H-M) the observation that the elasticity of US imports with respect to US economic activity exceeds the elasticity of US exports with respect to foreign economic activity. The elasticity ratio of about 2:1 appeared in the post World War 2 data, when H-M first published their findings in 1968 using aggregate US trade data spanning 1951-1966.
The relatively higher income elasticity of imports has persisted into the 21st century. Researchers have used different data disaggregations, different econometric methods, and different time periods to explore the source and stability of these findings. Mann and Pluck [1] found, in particular, that consumer demand for different kinds of products was an important source of the high elasticity of demand for imports. Overall, however essentially the asymmetry remains, and has had global ramifications.
First, to the extent that the US has persistently bought more imports than it sells exports, even when US and global growth are similar, the US trade deficit has tended to widen. Indeed the US trade deficit has been a feature of the global trading landscape for more than a generation, and over the 1990s, and 2000s in particular, it widened substantially to more than 6 percent of GDP. From the standpoint of global exporters, particularly China, the high US import elasticity yielded more robust export expansion than would have been the case if the H-M asymmetry did not exist. A complementary outcome of the H-M asymmetry has been international reserves build-up and the associated challenges of leaning against currency appreciation among our export partners, as well as the decision of how to invest those reserves.
It is therefore of some interest that, since the onset of the financial crisis and during the recovery in US GDP, H-M seems to have gone missing. The chart below shows the average annual growth rates for US real GDP and several categories of consumer goods imports. The green bars show the ratio of domestic growth to the growth of imports in the matched category for the historical period (1968-2010) and more recently 2011-2014q1. The decline in the ratio of import growth to domestic growth (the implied import elasticity) is apparent in each consumption category. One reason for the decline in implied import elasticity for consumer goods is the increasingly share of services in the consumptions basket, but that can’t be the whole story for the most recent period.
[1] “Understanding the US Trade Deficit: A Disaggregated Perspective,” (with Katharina Plück) in G-7 Current Account Sustainability and Adjustment, Richard Clarida ed.. MIT Press: Cambridge, 2007.Download the working paper version from www.CLMann.com.
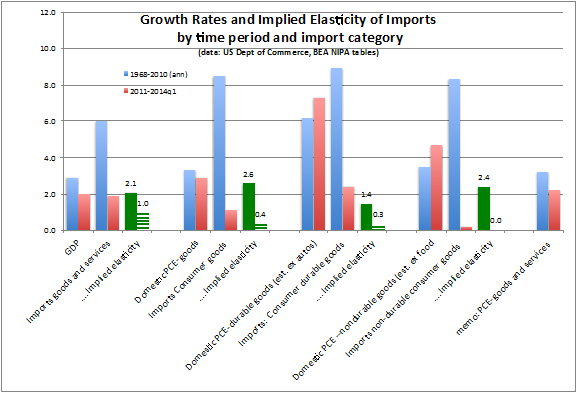
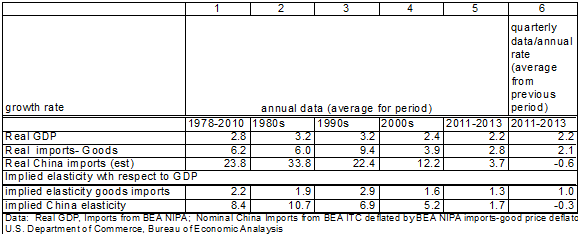
What are the ramifications of this apparent change in the relationship between domestic growth and imports, particularly for consumer goods? Considering trade flows, the trade deficit may not widen very much as the US economy builds steam. Foreign exporters to the US that have been importantly dependent on the US market for growth in exports may find that sales to the US market will remain sluggish. Indeed, the table below shows that the implied elasticity of imports from China has been falling. In recent quarters (emphasized by using quarterly data at annual rate growth from previous period as in column 6) suggest that imports from China have collapsed.
 If H-M has indeed gone missing, it has implications for other countries. Foreign exporters to the US that had expected to take over from China the production of relatively cheap and easy to produce consumer goods may not experience such a robust climate for their products as was the case over the 1990s and 2000s. In fact, projections for growth in global trade are muted, with the World Trade Organization projecting global trade growth for 2014 of 4.7%. Although the WTO projection for 2015 is at the 20-year average of 5.3%, global trade growth was substantially higher than that – around 6% — in the 1990s and 2000s before the bust. [1]
Considering the financial perspective, if foreign economies have less international reserves accumulation, because of smaller trade surpluses, this may imply less demand by foreign central banks for US Treasury securities (UST). During the past decades, the demand for UST by foreign investors, particularly China, allowed UST interest rates to be lower than they otherwise might have been. Now, with the Federal Reserve tapering their purchases of UST and potentially less demand from abroad, two sources of demand for UST will soften. UST interest rates could rise more quickly than expected.
Thus, it matters from both the real and well as financial perspectives and for the United States, China and the global economy, if Houthakker-Magee has gone missing.
[1]http://www.wto.org/english/news_e/pres14_e/pr721_e.htm

Catherine L. Mann
Rosenberg Professor of Global Finance, Brandeis University
![]()
![]()