Asia Drives Global Investment – a Self-priming Pump?
March 6, 2013
Global investment has skyrocketed in the past decade. Worldwide gross capital formation – i. e. private and government investment in machinery, equipment, buildings and inventories – climbed from US$ 7,000 billion in 2002 to more than US$ 17,000 billion in 2012. This contrasts with an absolute increase of a mere US$ 1,500 billion during the previous decade, 1992 to 2002. Moreover, in the latter part of that period, 1995 to 2002, global capital formation stagnated at a more or less constant level of US$ 7,000 billion.
Figure 1
Global investment
Nominal domestic capital formation (US$ billions)
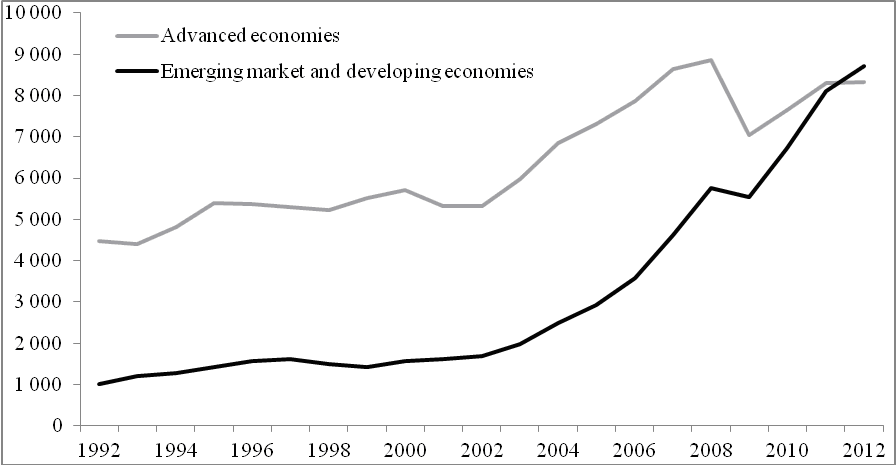
Sources: IMF; own calculations
As a result of this mighty investment boom, which took off in 2002, the global structure of capital formation has changed enormously (Figure 1). While only a quarter of global investment went to emerging markets and developing economies in 2002, this share surged to slightly more than 50 percent in 2012. For the first time in the modern age, the global investment volume was allocated to emerging and advanced economies in equal parts. This shift in weighting has accelerated in the last couple of years as investment in advanced economies has been impaired by the global financial market crisis. Investment in the industrialized countries has not yet regained the level of 2007 and 2008. By contrast, the financial market crisis has barely hit emerging economies. Their investment boom has continued almost unabated, reaching a new peak of US$ 8,700 billion in 2012.
The emerging market and developing economies contributed 70 percent of the total global increase in investment (US$10,000 billion) in the decade from 2002 to 2012. In the previous decade, distinctly moderate growth had been driven by the advanced economies. A closer look reveals that the latest global investment boom was powered by the emerging market and developing economies in Asia in particular. Among emerging markets Asian countries played a dominant role as an investment target. Around US$ 4,500 billion, or 45 percent, of the total increase in investment can be attributed to the emerging economies in the Far East (i.e. excluding the advanced Asian economies of Japan, Korea, Hong Kong, Taiwan and Singapore).
Of course, this can partially be explained by the high population of this region. In 2010, almost 4.2 billion people, or around 60 percent of the world population of almost 7 billion, lived in Asia. Even if the five advanced countries are excluded, Asia’s share of the world population still amounts to 58 percent. Figure 2 shows that the other emerging regions were virtually eclipsed by the Asian performance. This was especially true of the absolute increases in investment between 2002 and 2012 in Central and Eastern Europe (US$ 258 billion) and in Africa (US$ 215 billion), while the member countries of the European Union (US$ 1,162 billion ) still outperformed the Latin American and Caribbean countries (US$ 921 billion).
Figure 2
Structure of the global investment boom
Change of domestic gross capital formation 2002 to 2012 in US$ billion
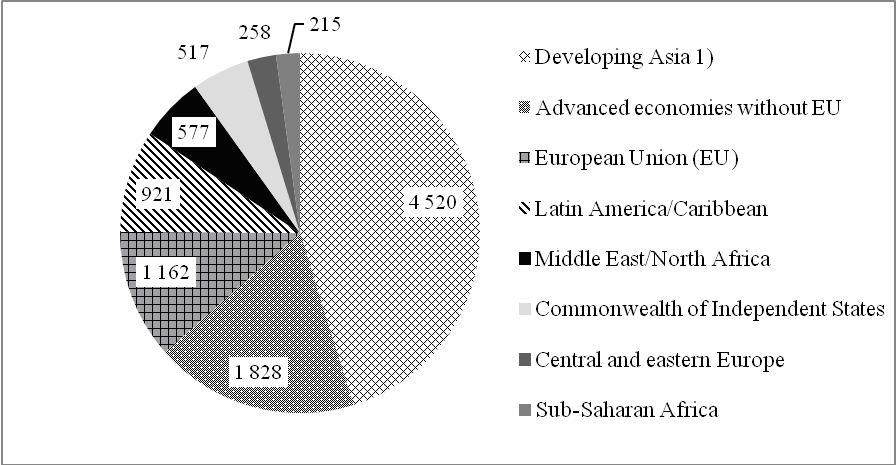
1) Asia excluding Japan, Korea, Hong Kong, Taiwan, Singapore.
Sources: IMF; own calculations
Emerging and advanced economies are diverging not only regarding investment dynamics but also with respect to the significance of investment in the domestic use of gross domestic product (GDP). However, this divergence has in turn contributed to the economic convergence of both country groups. While investment accounts for less than a fifth of GDP in advanced economies, the investment ratio (gross capital formation as a percentage of GDP) amounts to a third in emerging market and developing economies. Moreover, at 19 percent, the investment ratio of the advanced economies in 2012 was slightly lower than a decade ago (20 percent). In the European Union the ratio declined from 20 to 18 percent. In contrast, over the same period investment in emerging markets increased more or less steadily from a quarter to a third of GDP.
The Asian emerging market and developing economies dominate the overall picture (Figure 3): The Asian investment ratio was already by far the highest in 2002. From 2002 to 2012 the investment share of GDP climbed from 31 to 42 percent. This development reflects the enormous efforts made by Asian countries in capital formation and their preference for investment over consumption. The investment ratio of other emerging regions showed only a moderate increase. On average, investment as a percentage of GDP increased by only 2 percentage points. Moreover, the investment ratios in Central and Eastern Europe, Africa and Latin America are not markedly different from the values observed in the advanced economies.
Figure 3
Regional investment ratios
Domestic gross capital formation as a percentage of GDP
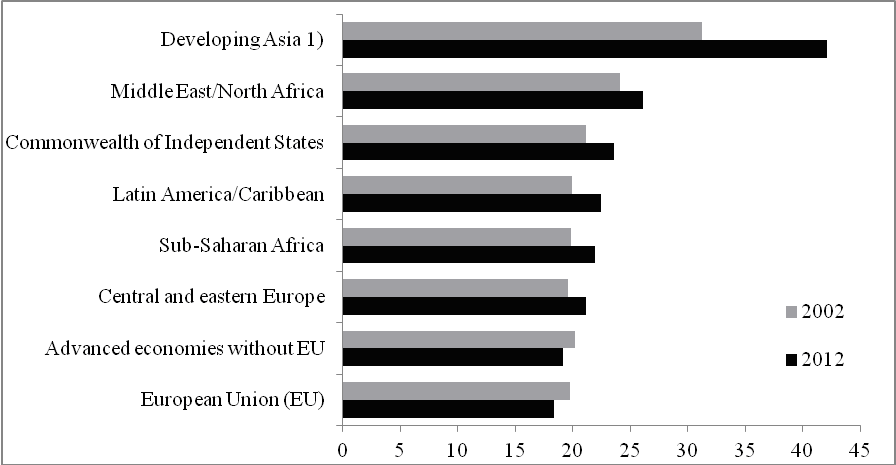
1) Asia excluding Japan, Korea, Hong Kong, Taiwan, Singapore. Sources: IMF; own calculations
Current forecasts predict that, on aggregate, the divergence of global investment activities between emerging and advanced economies illustrated in Fig. 3 will continue. In 2013 investment is expected to decline in some of the largest European economies, such as Germany, France, Italy and Spain. Japan may achieve at best a small increase. The USA, Canada and some Scandinavian countries can be expected to provide a modest contrast.
In most of the emerging economies, though, the investment boom is expected to continue. However, it cannot be taken for granted that the investment cycle in the emerging market and developing economies will be sustained: Some emerging markets will have to fight hard to remain an attractive location for investment. Several sizeable emerging markets in Asia, Africa and South America have benefited from the increasing global demand for natural resources and the resulting price increases. It is a moot point whether these countries can compensate for a possible cutback in their present growth driver with stronger domestic demand or exports of other goods. Certain other emerging economies, e. g. China, have already gained momentum from flourishing exports of manufactured goods. However, it remains debatable whether these countries can offset a possible deceleration in this segment – triggered by falling demand from Europe and the USA. The critical question is how flexible those economies are in adjusting their economic structures.
On the whole, the growing population in the emerging market and developing economies and their desire to catch up favor ongoing investment. If their standard of living is to continue to rise, there is no alternative to increasing capital formation and the capital-labor ratio.

Michael Grömling
Professor, Cologne Institute for Economic Research (IW) , International University of Applied Sciences, Bad Honnef / Bonn
![]()
![]()