China Research

A discussion forum on emerging markets, mainly China – from a macro, micro, institutional and corporate angle.

Russia’s Economic Growth will be much Slower in the Future

April 1, 2015

During the boom years between 2000 and 2008, Russian GDP grew by almost 7.5% per annum. This boom was caused by two interlinked factors: The global economy was growing at a very rapid pace, and the price of crude oil rose throughout the period. When the financial crisis hit major parts of the world, Russia’s economy was badly affected along with everybody else, but subsequently Russian growth has been slower than before the crisis. In addition, Russian GDP growth has decelerated almost continuously from 2011 onwards. (Figure 1)

Figure 1 Russia’s GDP growth

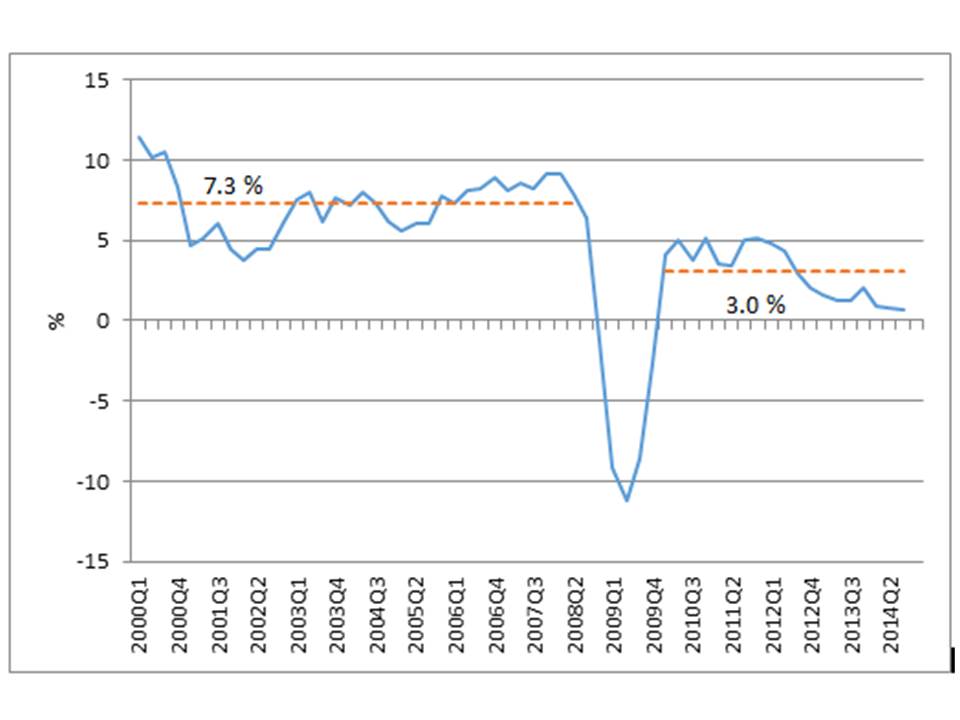
Source: Rosstat and own calculations

There was no obvious single reason for this slowdown, but some important factors should be noted. First, Russia’s working-age population had started to decrease, which automatically slows down GDP growth, ceteris paribus. Second, Russia’s fixed capital investment remained low, between 21% and 22% of GDP after the global financial crisis. While this would not be problematic for a country like, say, Germany, Russia’s investment ratio remained much below rapidly growing emerging market countries. Third, growth in productivity had become much slower already before the global financial crisis (Voskoboynikov and Solanko, 2014). Last, the price of oil remained high, but it did not increase as it did between 2000 and 2008.

Deryugina and Ponomarenko (2014) use a large Bayesian VAR model to assess the relative importance of various macroeconomic factors in explaining the evolution of Russia’s GDP. They find that the oil price together with demand from the EU are enough to forecast and explain most of the short-run movements in Russian GDP. Rautava (2013) notes a similar dependence on the price of oil. Even more interestingly, he notes that Russia’s trend growth halved to approximately 2% after the global financial crisis.

Role of oil

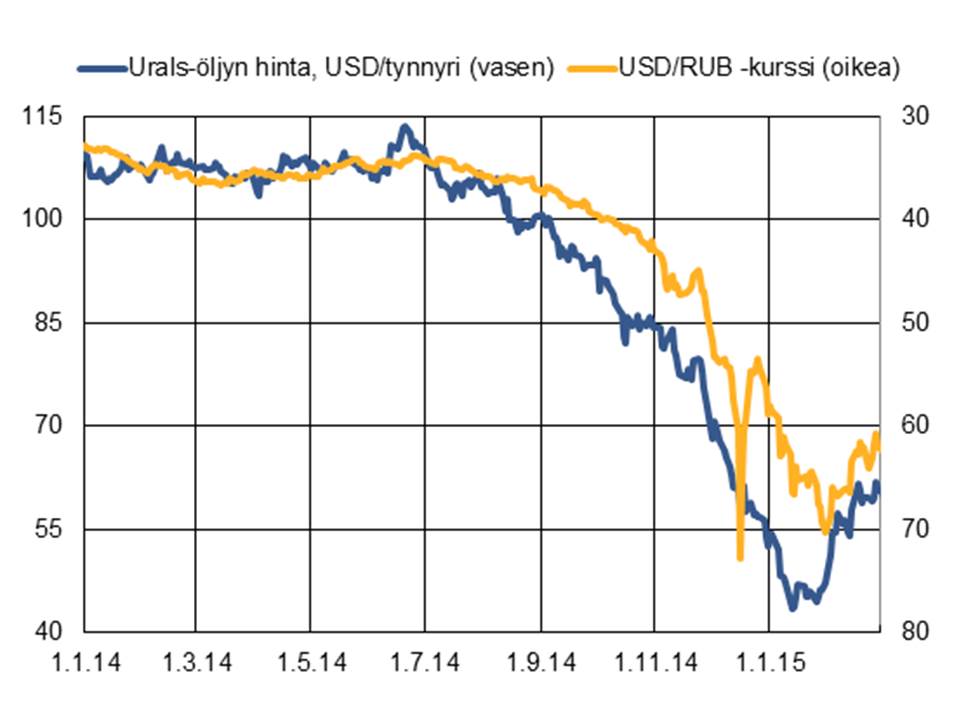
It is difficult to overstate the importance of energy prices for the Russian economy. Crude oil, oil products and natural gas brought 70% of Russia’s export revenue in 2014, and the energy sector provides the Russian Federation with more than 50% of its tax intake. Figure 2 illustrates the tight connection between the price of oil and Russia’s exchange rate.

Even after the introduction of sanctions in July, the Russian currency and financial markets remained relatively calm, but the rouble started its steep depreciation when the price of oil plummeted. Connection works in the other direction as well, of course. When the price of oil stabilized and recovered somewhat in February and March, 2015, the rouble reacted in the same direction as well.

Long-run growth slower than before

Unfortunately, Russia’s long-run growth prospects are not very rosy either, especially in comparison to the development in the recent years. We know very well about the evolution of the working-age population during the next 20 years, as almost all people coming into working-age have already been born. According to the UN prediction, Russia’s working-age population will decline from 90.7 million in 2015 to 78.7 million in 2035, which translates into -0.7% change annually on average.

Figure 2 Price of crude oil and the rouble

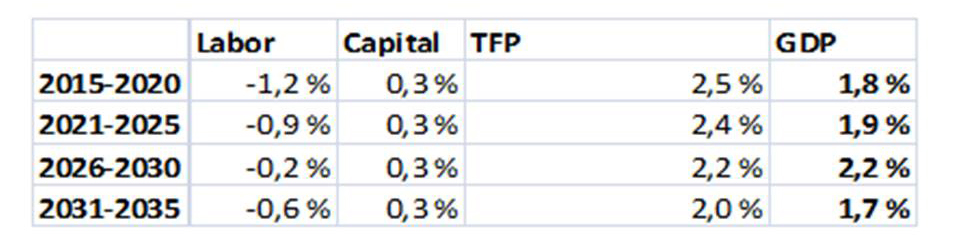
Even if one assumes that the capital stock will grow somewhat – say by 0.3% per annum, which is higher than recently – for the next twenty years, and total factor productivity also rises at a relatively rapid – but decelerating – pace, Russia’s GDP growth will be below 2% for the next twenty years (Table 1). This is clearly below what Russians have become used to in recent years. Also, Russia’s share of global GDP continues to decline. Moreover, Russia’s growth needs to be driven by total factor productivity. Voskoboynikov and Solanko (2014) estimate that it grew by 2.5% per annum between 1995 and 2008. Therefore, keeping Russia’s growth relatively fast at higher income levels might be difficult.

Table 1 Baseline scenario for Russian growth


References

Deryugina, Elena and Alexey Ponomarenko (2014). A large Bayesian vector autoregression model for Russia. BOFIT Discussion Paper 22/2014.

Rautava, Jouko (2013) Oil Prices, Excess Uncertainty and Trend Growth – A Forecasting Model for Russia’s Economy. Focus on European Economic Integration. Q4/13, Oesterreichische Nationalbank.

Voskoboynikov, Ilya and Laura Solanko (2014). When high growth is not enough: Rethinking Russia’s pre-crisis economic performance. BOFIT Policy Brief 6/2014.


Iikka Korhonen
Head of Bofit (Institute for Economies in Transition) at the Bank of Finland

Back to Start page

Chinese Patents Gain Momentum – But Still Insufficient Transparency

According to the WIPO (World Intellectual Property Organization) – an agency of the United Nations – China was ranked in 2014 as the number three PCT (Patent Cooperation Treaty ) application country in the world, summing up its filing to totally 25 539. It should be added that the WIPO totally gathers nearly 190 member states. According to the WIPO’s website, the “PCT assists applicants in seeking patent protection internationally for their inventions … By filing one international patent application under the PCT, applicants can simultaneously seek protection for an invention in 148 countries throughout the world… “

This good Chinese ranking last year gave a global “market” share of almost 12%, after the U.S. (29%) and Japan (20%), and before Germany (somewhat above 8%). The Swedish share turned out to be relatively high (close to 2 %, 3925 applications, no 10 globally) – but 0.7% came alone from Ericsson; the total Swedish market share, however, has been declining somewhat compared to 2013. In the Chinese case, 1.6 % of all global PCT applications could be related to Huawei – the largest patent applier in the world – and 1% to ZTE (both representing the telecom and mobile business).

One may also note that other BRICS countries – if we still use this somewhat obsolete term – so far achieved very modest PCT-applications numbers compared to China’s 25 539 (India 1394, Russia 890, Brazil 581, South Africa 297; see also BOFIT Weekly 13/2015). China is indeed very ambitious when it comes to new technology and new products which I pointed at before a couple of times when discussing the strategic communiqué from the Third Plenum from November 2013 with its 16 chapters and 60 subchapters, many of them shadowing the New Growth Theory created by Paul Romer and consortes (who, by the way, would be a dignified Nobel Prize winner this year).

At the same time, however, one should not neglect that China’s PCT application numbers are misleading to some extent, even if it is hard to be more precise on what “to some extent” means in reality. We know that a substantial share of the Chinese applications do not stick to what can be called inventions in a real innovative sense. People I have been talking to have “guestimates” that only around one fourth or so of all Chinese PCT applications were justified from a strict innovative angle – but the same experts pointed also at the obvious fast upturn of genuine new Chinese patents and some slight general improvement of the enforcement of the Chinese patent law (see on this issue Ying Zhan, “Problems of Enforcement of Patent Law in China and its Ongoing Fourth Amendment”, Journal of Intellectual Property Rights, July 2014). In this context, Ying Zhan stresses the view that the Intellectual Property Right (IPR) system is a “Western imported system that takes more time to root in China”.

Altogether, there is no doubt that China is an increasingly important player on the global patent market – also what concerns the number and market share of technologically advanced innovations. But I would appreciate more transparency in this respect – and more and better research in this specific issue. Well-working patents are an important part of a promising innovation climate – and a promising and further improved innovation climate must be regarded as one of the decisive cornerstones of China’s new, future-oriented growth policy.

We should follow these trends that probably will affect us more than most of us imagine today.


Hubert Fromlet
Senior Professor of International Economics, Linnaeus University
Editorial board


Back to Start Page

What’s Next for the Commodity Supercycle?

March 4, 2015

As crude oil prices have plunged in recent months, there has been a lot of talk about the end of the commodity supercycle. For those of us who trade in other commodities, or follow the Chinese economy, this realization is a bit late. Many commodities have already gone through the correction that is now facing crude oil, and many lessons can be learned by their experience. However, oil, like all commodities, will have characteristics that are all its own. This article lays out a history of recent commodity price movements – first violently up and now just as violently down – and insights on why they occurred. The next move for commodities is likely to be a considerable period of consolidation, with prices trading in a narrower range as both suppliers and consumers of commodities adjust to the interim new normal of a rough balance between supply and demand. We see another explosion in commodity prices on the far horizon as the next wave of global consumers – with an impact even larger than China’s entry – make their way onto the world stage.

For us, the global commodity supercycle began on July 20, 2005, which was the day that the Chinese government first allowed the yuan to appreciate from its long fixed ratio of 8.28 to the dollar. The Hu-Wen Government was in the third year of their leadership and was beginning to implement their policies of expanding into the west. Allowing the yuan to appreciate both tamed the American anger over alleged currency manipulation and forced coastal provinces to move up the technological ladder as labor costs rose. The advances China enjoyed since its admission to the WTO in 2000 would now spread from the 300 million beneficiaries in the coastal provinces and cities to the additional billion Chinese living inland.

From mid-2005 to mid-2008 the yuan appreciated roughly 20%, at the same time China’s nominal GDP growth was averaging about 20% per year. As a result, China’s buying power in dollars – the currency of international exchange for all commodities – accelerated from a 15% growth rate in early 2005 to over 35% just before the Lehman crisis. Booming real GDP growth and a soaring ability to pay made China the price setter for all commodities – and the major global purchaser of just about all kinds of resources. Iron ore consumption more than trebled from 14% of the world’s production in 2000 to 61% in 2010. Soybeans more than doubled from 23% to 59%; copper from 13% to 29%; coal from virtually no imports in 2000 to 15% of the world supply by 2010. By 2011, China was consuming more than 25% of the world’s supply of nearly everything – except oil, which languished at a paltry 10% roughly in line with China’s share of world GDP.

With China as the world’s biggest purchaser, the commodity supercycle was not derailed by the Lehman crisis. To the contrary, as the financial markets of the western world collapsed, China merely stopped its steady currency appreciation. However, as the result of the massive 4 trillion yuan stimulus in early 2009, nominal GDP growth – which is to say buying power for commodities — had rebounded to 18%, with real growth near 9%. By mid-2010, with the economy booming again and inflation running near double digits, China again began to appreciate the yuan – stemming growth and inflation at home, while increasing its international buying power for ever more expensive commodities. With China running red hot, global supply of commodities still had not caught up with demand and prices moved higher as the invisible hand worked to call out new technologies and exploration of more remote regions.

The day the Supercycle died was March 11, 2011 – the day the Japanese tsunami unexpectedly disrupted supply chains across much of Asia. The budding recoveries in the US and Europe, which started after the first round of the Greek crisis in 2010, were put on hold. Meanwhile, commodities production which had been whipped ever higher by prices finally caught up with demand as world growth paused. Virtually every major commodity hit a peak sometime in early 2011. Copper (the metal with the PhD in economics) top ticked in February and retested that high in August. Gold, silver and cotton all hit record highs. Grains faded, then temporarily made fresh highs in the spring of 2012 on poor harvests, but ultimately declined. Aluminum, platinum and crude oil, which had not recovered to pre-Lehman highs, started their descent. Oil has fared better than most commodities since 2011, in part because the tsunami’s shutdown of the Japanese nuclear reactors provided a final surge in demand that was not experienced by any other product.

On the backside of a commodity cycle, falling prices seek to drive out the marginal producer – which in the short run means the operator with the highest variable costs. With fixed costs high for many commodities, due to land and the sunk cost of capital investment, variable costs are generally far lower than the price previously needed to call out new production. Moreover, the costs of inputs for commodities production tend to tumble along with output, so variable costs decline rapidly in a correction. The experience across many commodities shows us that the bottom generally comes above the price needed back in 2005 to first call out new supply. Corn has bottomed near $3.30, its low in 2007 and 2009. Aluminum broke out from $1750 and bottomed there in late 2013. Similarly, platinum broke out and has retreated to $1200. Silver, cotton and natural gas have similar charts. Oil below $$60 appears to have met this condition. Copper and gold have avoided a complete retreat – so far.

As in a financial crisis, it is often the margin clerks – the bankers – who decide who survives and who does not. At the bottom, those firms with the strongest hands are able to pick up bargains. In past cycles, the winners with strong hands have tended to be industry participants with the knowledge and moxie to take on the risk of shattered competitors. Currently, due to the surplus of savings still available in the world – and zero interest rates for risk free investments – there are more financial players snapping up assets hoping to sell to operators later.

It is our view that the $50 a barrel decline in oil prices is just what the global economy needed to spark a worldwide recovery. At 80 million barrels a day, this tax cut – financed by the oil producers – is equivalent to $1.5 trillion a year, or 2% of world GDP. That’s a fairly robust stimulus by normal Keynesian standards. Most critical for commodities is whether the decline in prices will re-ignite growth in China, the world’s biggest consumer. We believe that Chinese growth faded to 4% last year – as indicated by electricity use – and will rebound to closer to 7% in 2015. Stronger Chinese demand should help stabilize commodity prices, but we expect the next rise is still a ways off as many resource producers are being acquired at deep discounts financed by near zero money.


The real spark for the next commodity cycle is likely to come from a broadening of global demand into the next tier of Asian producers – Indonesia, the Philippines, Vietnam, the next 100 million employees in India and the remainder of rural China. These populations combined are larger than the initial development of the Chinese coast or the first push inland. Chinese growth started slowly when Deng Xiaoping allowed Guangdong province to tap into the capital and managerial expertise of Hong Kong. The experiment accelerated when the opening to WTO brought in more foreign capital to the mainland and managers spread their local knowledge to China’s east coast. Under Hu and Wen, that success was forced inland by currency appreciation and infrastructure investment.

Now, under Xi and Li, China appears ready to go out and share its system of success with anyone willing to accept their money and immigrant labor. Bottom line, the population of educated managers, like the supply of previously scarce commodities, has caught up with world demand – and the price of developing the next tier of global expansion is declining. These new nations, like China in 2000, have low incomes and a voracious appetite for commodities. Moreover, the techniques the Chinese will teach are likely to be commodity intensive – as you teach what you know. Thus, we expect another commodity super cycle on the far horizon as better global growth raises all boats.


Michael Drury
Chief Economist, McVean Trading & Investments

Back to Start Page