China Research

A discussion forum on emerging markets, mainly China – from a macro, micro, institutional and corporate angle.

Will the New Government Drive Major Changes in Economic Policy Making? – Thoughts Resulting from Observations of China’s Solar Energy Policies

March 6, 2013

These days we observe the transition to a new government in China, which will be endorsed by the National People’s Congress. The renewal of the government follows the election of a new Party leadership last November. Since then, all kinds of speculations and discussions have emerged concerning the expected ideas and potential political targets of the new Party leadership. Obviously some emphasis will be put on fighting corruption. But will their also be changes in economic policies? Will new ideas regarding the appropriate economic governance emerge? How will the new government handle state-owned enterprises? How much influence will the central government excise on large enterprises? How will it treat the tendency of local governments to intervene in and interlock with local business?

We do not know the answers yet. So let me look into a specific sector to highlight the questions at hand… and the degree of obscurity we still have to face.

Just a few days before the opening of the NPC meeting, the State Grid Corporation published a document called ‘Opinions regarding our services to smoothen grid integration of decentralized electricity generation’. What may appear to be a minor document is just the latest step in a wave of support initiatives for an ailing industry: the solar energy sector.

There are some interesting things that can be learned from reading these ‘Opinions’ in the context of the politics of the last months:

– The ‘Opinions’ confirm – just a few days before the new government steps in – a policy direction that was prepared over the last year. The 12th FYP for the solar energy manufacturing sector endorsed in February 2012 as well as the 12th FYP for solar energy electricity generation propagated in July 2012 both already announced support for decentralized solar PV use and grid integration. Hence, whatever the changes are at the leadership level, at the more concrete policy level, we can observe continuity at least over the last twelve months. The idea to support the ailing solar industry by pushing for decentralized installations was a highly contentious issue before 2012, but has survived the political struggles of the last year. So, either the new leadership already had considerable influence at that time, or the differences between the new and former leaders are not that big at all.

– The ‘Opinions’ substitute a document called ‘Preliminary opinions regarding our services to smoothen grid integration of decentralized solar energy electricity generation’ published in October 2012. Between October and late February the wind energy and other renewable energy sectors have managed to enter the ‘Opinions’ and therefore to secure the favourable service conditions originally promised by State Grid Corporation only to solar-based electricity generation. At the same time the promised speed of services was somewhat reduced. This demonstrates several characteristics of policy making in China today: First, rules and regulations are often initially published in a preliminary version in order to allow for experiments and later corrections. Second, changes to the preliminary versions actually happen. Third, a considerable degree of lobbying seems to occur in this process. Again, this hints more to continuation than change in Chinese economic policy making.

– The ‘Opinions’, published by the State Grid Corporation, document better coordination between different ministries and actors in energy policies. Past policies and instruments to support the national solar industry are said to have suffered from the absence of support by the State Grid Corporation. As the ‘Opinions’ follow the ideas advanced in the sectoral 12th FYPs of the Ministry of Industry and Information Technology and the Energy Department of the NDRC respectively, it seems that this time the State Grid Corporation was better integrated into the policy making process than before. Allegedly State Grid was not consulted for the design of the ‘Golden Sun’ policy, which was initiated in 2009 to bolster PV deployment in China, and therefore did not support implementation actively. So, the ‘Opinions’ may indicate a better handling of a big power player like the State Grid. However, it also confirms the powerful position of State Grid with regard to energy policies.

– The ‘Opinions’ promise that State Grid will cover most of the grid integration costs for renewable energy projects apart from the investment in the renewable energy technology as such. It will also allow for separate measurement of the electricity used and the electricity fed into the grid by the installer. While the former will obviously lessen the overall investment costs and the latter will provide a service needed to calculate decentralized electricity generation, so far the electricity prices or, more accurate, the level of subsidies paid for solar PV electricity generated by decentralized projects have not yet been defined. Therefore, as in the past, it is unclear whether the new policies will trigger a substantial investment wave in the national market.

There seems to be more continuation than change to be discerned from this example. There is support for local solar energy deployment, but it still is half-hearted. And, alas, the impression of continuation is confirmed by Chinese media reports complaining that these and other initiatives to support the local industry are designed in a way that favours state-owned and state-backed companies in the solar manufacturing sector. In the past the Chinese solar manufacturing industry excelled in international markets mainly due to the success of private enterprises. In contrast, the low level of regulatory transparency, like the lack of a clear rule on subsidies, in the promotion of the solar energy at home, implies a policy bias toward state-backed companies. These can take higher risks and receive investment support from local banks even in situations where the investment environment is volatile and the expected return on investment is questionable.

In sum, for the time being we should expect major changes and reshuffles in the Chinese solar sector as a result of a high level of continuation in the general course of economic policies.


Doris Fischer
Professor, University of Würzburg, China Business and Economics


Back to Start Page

Asia Drives Global Investment – a Self-priming Pump?

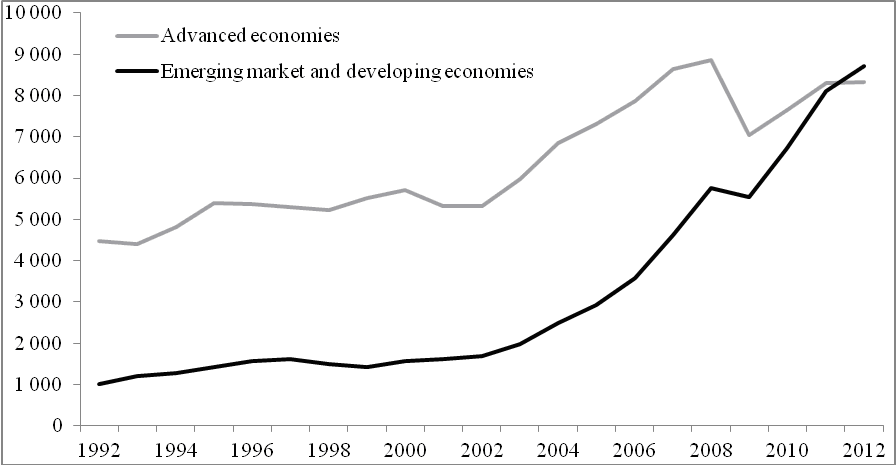
Global investment has skyrocketed in the past decade. Worldwide gross capital formation – i. e. private and government investment in machinery, equipment, buildings and inventories – climbed from US$ 7,000 billion in 2002 to more than US$ 17,000 billion in 2012. This contrasts with an absolute increase of a mere US$ 1,500 billion during the previous decade, 1992 to 2002. Moreover, in the latter part of that period, 1995 to 2002, global capital formation stagnated at a more or less constant level of US$ 7,000 billion.

Figure 1
Global investment

Nominal domestic capital formation (US$ billions)

Sources: IMF; own calculations

As a result of this mighty investment boom, which took off in 2002, the global structure of capital formation has changed enormously (Figure 1). While only a quarter of global investment went to emerging markets and developing economies in 2002, this share surged to slightly more than 50 percent in 2012. For the first time in the modern age, the global investment volume was allocated to emerging and advanced economies in equal parts. This shift in weighting has accelerated in the last couple of years as investment in advanced economies has been impaired by the global financial market crisis. Investment in the industrialized countries has not yet regained the level of 2007 and 2008. By contrast, the financial market crisis has barely hit emerging economies. Their investment boom has continued almost unabated, reaching a new peak of US$ 8,700 billion in 2012.

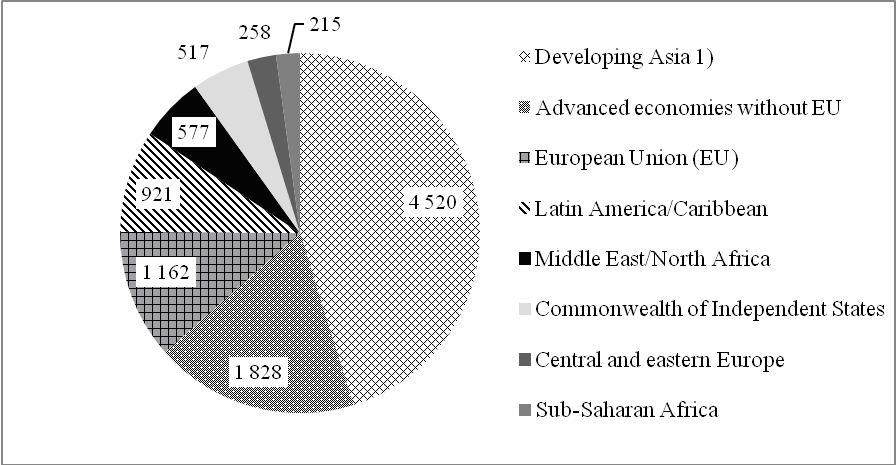
The emerging market and developing economies contributed 70 percent of the total global increase in investment (US$10,000 billion) in the decade from 2002 to 2012. In the previous decade, distinctly moderate growth had been driven by the advanced economies. A closer look reveals that the latest global investment boom was powered by the emerging market and developing economies in Asia in particular. Among emerging markets Asian countries played a dominant role as an investment target. Around US$ 4,500 billion, or 45 percent, of the total increase in investment can be attributed to the emerging economies in the Far East (i.e. excluding the advanced Asian economies of Japan, Korea, Hong Kong, Taiwan and Singapore).

Of course, this can partially be explained by the high population of this region. In 2010, almost 4.2 billion people, or around 60 percent of the world population of almost 7 billion, lived in Asia. Even if the five advanced countries are excluded, Asia’s share of the world population still amounts to 58 percent. Figure 2 shows that the other emerging regions were virtually eclipsed by the Asian performance. This was especially true of the absolute increases in investment between 2002 and 2012 in Central and Eastern Europe (US$ 258 billion) and in Africa (US$ 215 billion), while the member countries of the European Union (US$ 1,162 billion ) still outperformed the Latin American and Caribbean countries (US$ 921 billion).

Figure 2
Structure of the global investment boom

Change of domestic gross capital formation 2002 to 2012 in US$ billion

1) Asia excluding Japan, Korea, Hong Kong, Taiwan, Singapore.
Sources: IMF; own calculations

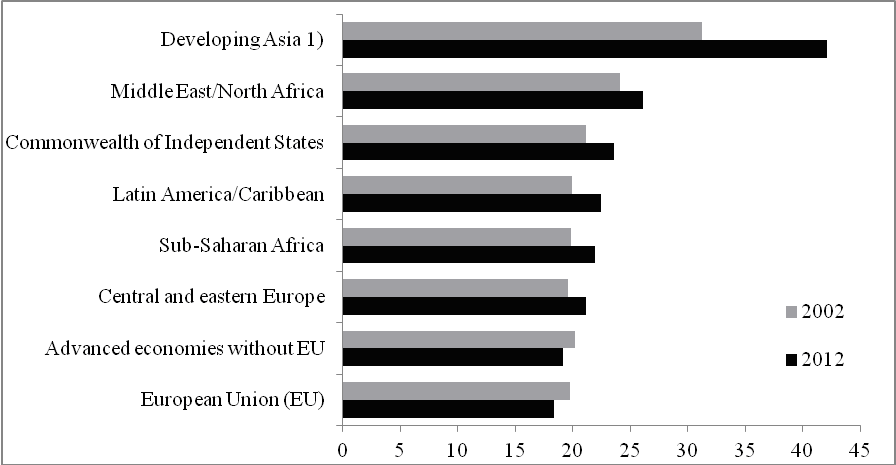
Emerging and advanced economies are diverging not only regarding investment dynamics but also with respect to the significance of investment in the domestic use of gross domestic product (GDP). However, this divergence has in turn contributed to the economic convergence of both country groups. While investment accounts for less than a fifth of GDP in advanced economies, the investment ratio (gross capital formation as a percentage of GDP) amounts to a third in emerging market and developing economies. Moreover, at 19 percent, the investment ratio of the advanced economies in 2012 was slightly lower than a decade ago (20 percent). In the European Union the ratio declined from 20 to 18 percent. In contrast, over the same period investment in emerging markets increased more or less steadily from a quarter to a third of GDP.

The Asian emerging market and developing economies dominate the overall picture (Figure 3): The Asian investment ratio was already by far the highest in 2002. From 2002 to 2012 the investment share of GDP climbed from 31 to 42 percent. This development reflects the enormous efforts made by Asian countries in capital formation and their preference for investment over consumption. The investment ratio of other emerging regions showed only a moderate increase. On average, investment as a percentage of GDP increased by only 2 percentage points. Moreover, the investment ratios in Central and Eastern Europe, Africa and Latin America are not markedly different from the values observed in the advanced economies.

Figure 3
Regional investment ratios

Domestic gross capital formation as a percentage of GDP

1) Asia excluding Japan, Korea, Hong Kong, Taiwan, Singapore. Sources: IMF; own calculations

Current forecasts predict that, on aggregate, the divergence of global investment activities between emerging and advanced economies illustrated in Fig. 3 will continue. In 2013 investment is expected to decline in some of the largest European economies, such as Germany, France, Italy and Spain. Japan may achieve at best a small increase. The USA, Canada and some Scandinavian countries can be expected to provide a modest contrast.

In most of the emerging economies, though, the investment boom is expected to continue. However, it cannot be taken for granted that the investment cycle in the emerging market and developing economies will be sustained: Some emerging markets will have to fight hard to remain an attractive location for investment. Several sizeable emerging markets in Asia, Africa and South America have benefited from the increasing global demand for natural resources and the resulting price increases. It is a moot point whether these countries can compensate for a possible cutback in their present growth driver with stronger domestic demand or exports of other goods. Certain other emerging economies, e. g. China, have already gained momentum from flourishing exports of manufactured goods. However, it remains debatable whether these countries can offset a possible deceleration in this segment – triggered by falling demand from Europe and the USA. The critical question is how flexible those economies are in adjusting their economic structures.

On the whole, the growing population in the emerging market and developing economies and their desire to catch up favor ongoing investment. If their standard of living is to continue to rise, there is no alternative to increasing capital formation and the capital-labor ratio.


Michael Grömling
Professor, Cologne Institute for Economic Research (IW) , International University of Applied Sciences, Bad Honnef / Bonn


Back to Start Page

The Limits of Chinese Statistics

The main content of this blog article is not really new. I have been pointing several times before at the insufficiencies of Chinese economic statistics, both in this blog and in published articles – despite obvious statistical improvements in recent years.

We should not, however, judge the shortcomings of Chinese statistics from a position of Western arrogance. In the 1980s, the U.S. had a marked downsizing of statistical quality – a downsizing process that then, fortunately, was successfully combated with all thinkable energy, for example, by NABE’s (National Association for Business Economics, Washington D.C.) statistical front woman Maureen Haver. Furthermore, it is still not very unusual that major statistical revisions happen even in developed countries considerable time after the first publication date. Not to talk about the poor quality of Greek statistics before the eruption of the crisis!

We should understand that China in a statistical sense rather can be described as a whole continent than a single country. The gigantic size of China makes it certainly difficult to make necessary surveys really representative and to single out the appropriate methods for different calculations. That’s the side of the coin that should make us humble. On the other hand: China could do much more about statistical transparency and the quality of statistical publications.

For foreign analysts who are not able to read Chinese characters, the “Statistical Communiqué of the People’s Republic of China on the 2012 National and Economic Development” should be the most interesting source to find a summary for the previous year (without in this context considering the quality of the quoted different statistical indicators). But there are obviously statistical weaknesses that quite easily could be eroded.

For example, distinctions between nominal and real numbers are not always clear (which goes back to the old system with its references to nominal changes). Average numbers and year-on-year comparisons are not singled out sufficiently. GDP calculations do not show systematically the usual components from the expenditure side. Different price deflators in the national account cannot be found in the above-mentioned statistical summary (which I would be very keen to know more about, likewise a split into private and public consumption). Further shortcomings could be mentioned.

But we get informed on other issues which may be quite interesting. Some examples for 2012 are given below according to the latest official statistics (without real knowledge from my side about the size of underestimations or overestimations):

– total population: 1 354 million (male share 51.3 percent)
– urban population: 52.6 percent (=share in 2012; +1.3 percentage points      compared to 2011!)
– employment: 767 million (of which 152 million in unemployment insurance     programs)
– total number of migrant workers within China: 263 million
– annual per capita income, rural : 7 917 yuan (RMB, about 1250 USD)
– total GDP: 51 932 million yuan (+ 7.8%; value shares agriculture 10.1,    industry 45.3, services 44.6)
– R&D: 2 percent of GDP
– Chinese direct investment abroad: 77.2 billion USD (+ 28.6 percent;    FDI into China: 111.7 billion USD)
– increase of savings (+14.1 percent) and increase of credits (+15.6 percent)
– CPI: +2.6 (for food +4. 8 percent)
– kindergartens (number of attending children): 37 million

To summarize: it should be an important commitment to the new Chinese leaders to strongly support increased statistical transparency and qualitative improvements. Both China itself and the whole (analytical) world would benefit from such a development in the second largest economy in the world.


Hubert Fromlet
Professor of International Economics
Editorial board


Back to Start Page